How We Research This Site: Sources and Methodology
This site publishes cost information and installation guidance for Oregon. It does not sell or install flooring, and nobody from it will call you.
Where the housing figures come from
Every housing statistic on this site is from the U.S. Census Bureau’s American Community Survey 2020–2024 5-year estimates — table B25035 for median year structure built, B25034 for the year-built buckets and B01003 for population. Place codes come from the Census Gazetteer, and every one was verified by name against the same data response the numbers were read from before it was used.
That verification is not ceremonial. Place codes are easy to get wrong, and a wrong one returns entirely real-looking numbers for a different town.
Where the climate figures come from
Precipitation totals and wet-day counts are NOAA/NCEI 1991–2020 climate normals. A wet day is one with 0.01 inches or more of precipitation. These are thirty-year averages, not forecasts, and they are the basis for everything this site says about the difference between the two sides of the state.
Where the wood guidance comes from
The interior conditions and moisture content ranges cited here — 30–50% relative humidity at 60–80°F, flooring at 6–9% moisture content, an equilibrium moisture content of 7.7% at 70°F and 40% relative humidity — are the National Wood Flooring Association’s published specifications. Janka hardness figures are the standard published values. Where this site describes what installers in a particular part of Oregon actually target, it says so as a regional practice rather than as a specification.
Where the cost ranges come from
Installed cost bands are published planning ranges for Oregon, expressed as a low and a high per square foot. The estimator applies your area, your material, your conditions and a regional labor multiplier to those bands. The regional multiplier is applied to the labor half only, because material is a national commodity and inflating it would be inventing a number.
The low and high bounds are computed independently — the low figure is every low rate, the high figure is every high rate. That is a deliberately wide band. Narrowing it by averaging would make the result look more precise than the inputs justify.
What this site does not do
- It does not sell or install flooring, quote jobs, or pass details to contractors.
- It has no crews, no completed jobs and no customers, and it does not publish testimonials or reviews, because it has none to publish.
- It does not collect email addresses to release a number. The estimator runs in your browser and shows its arithmetic.
- It does not assess any individual building. What it describes is what a climate does to a material.
Photography
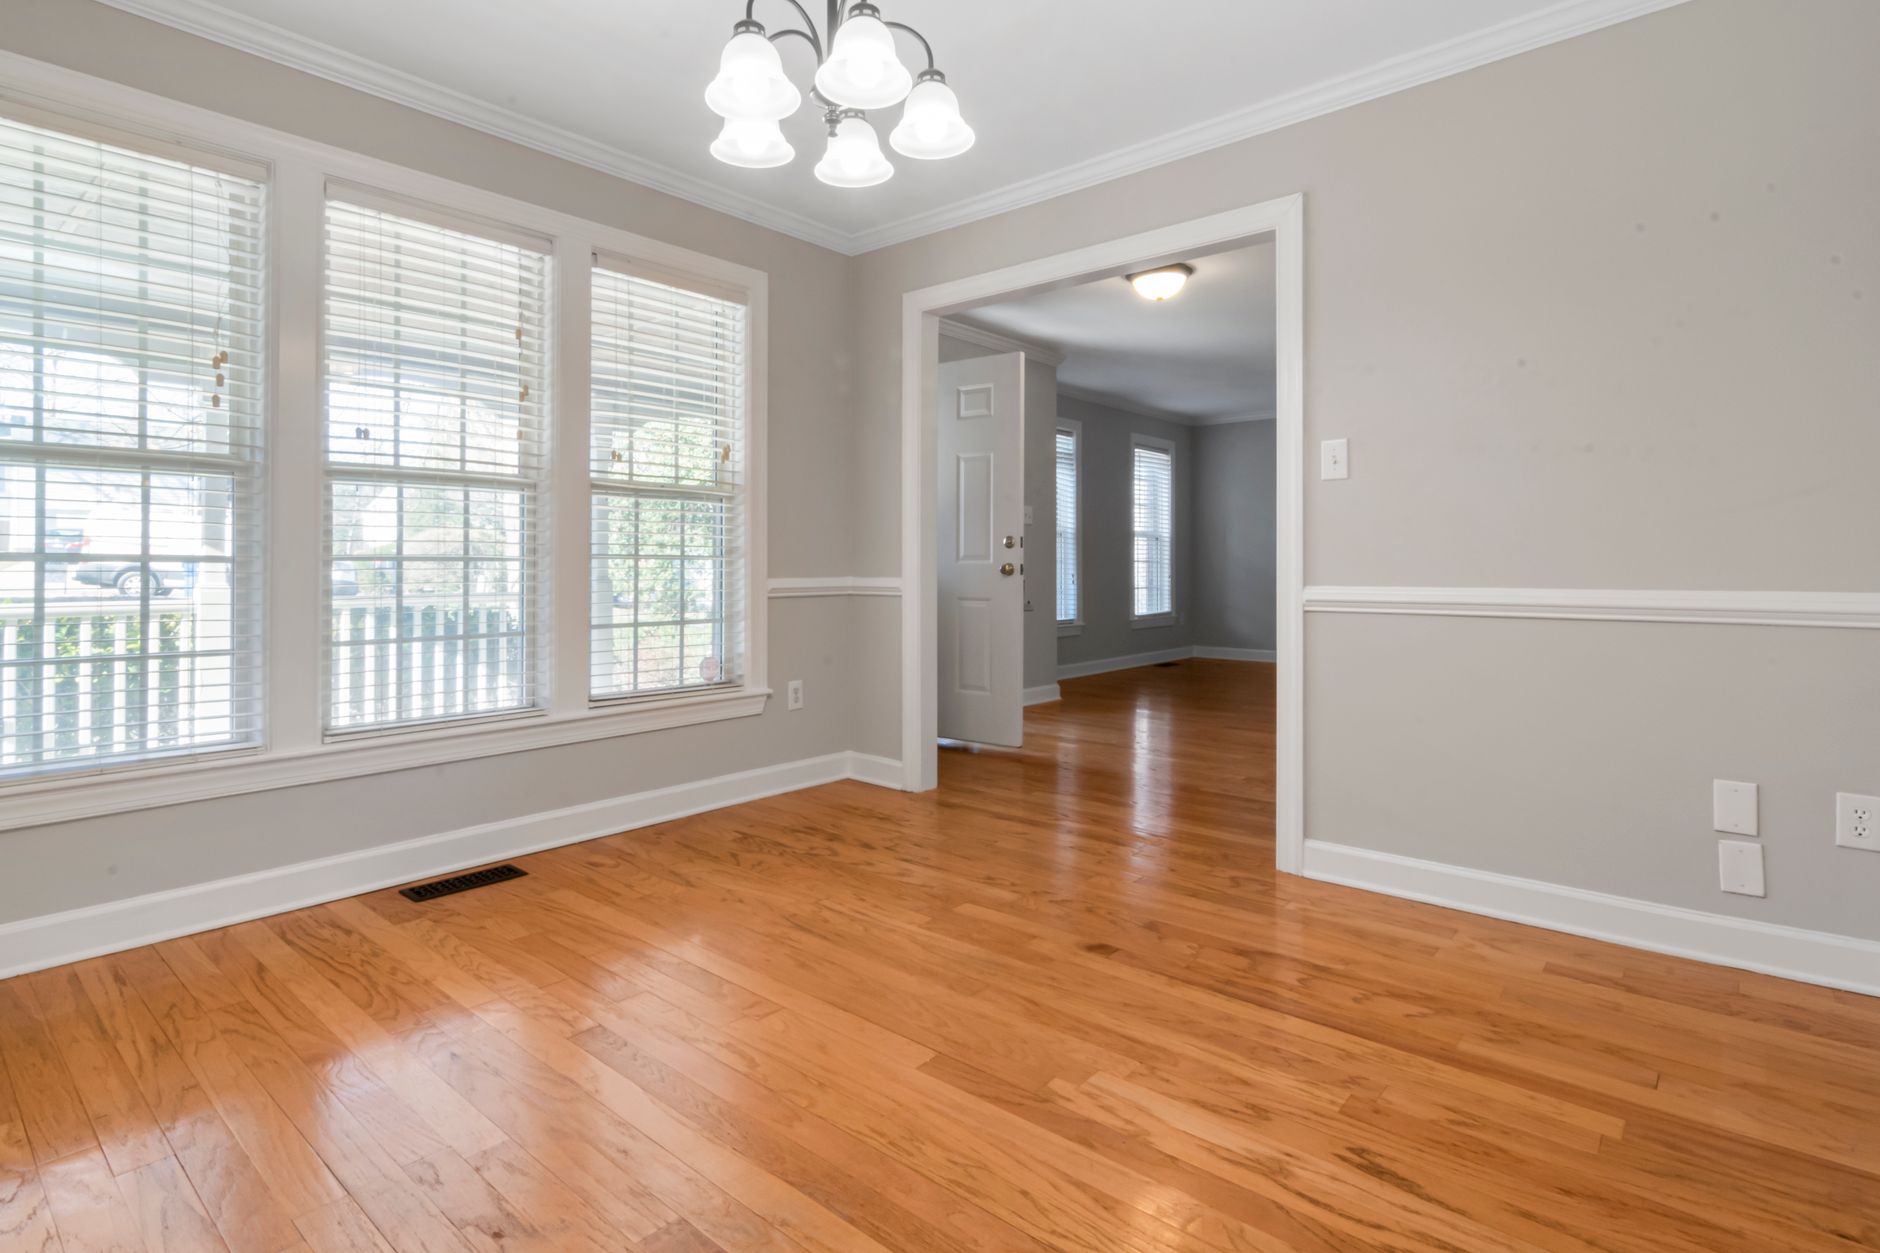
Photographs are licensed stock used to illustrate materials and rooms. They are not work by anyone connected with this site.
Corrections
If a figure here is wrong, it should be fixed. Contact details are in the footer.